
Google Analytics 4 brings a whole raft of changes and a completely new way of processing and analysing your data compared to Universal Analytics. In this blog post, we’re not going to get into the details of the differences between UA and GA4, which have been covered elsewhere. But we will show you how to use and create custom reports within the new platform, so you can track and measure the data that matters to you.
This and much more can be found in our free training course The Essential Guide to GA4. In it, you’ll learn the steps needed to make the switch and find some easy-to-follow guides on the new (but very different) insights and reporting. Find out how to navigate the existing Google Analytics reports, and create custom reports for your organisation.
So let’s get started!
Understanding the Google Analytics 4 Reporting Interface
To begin customising your GA4 reports, you’ll first need to understand some of the main elements of the new interface. There are several standard reports you are likely to use, each with additional subsections:
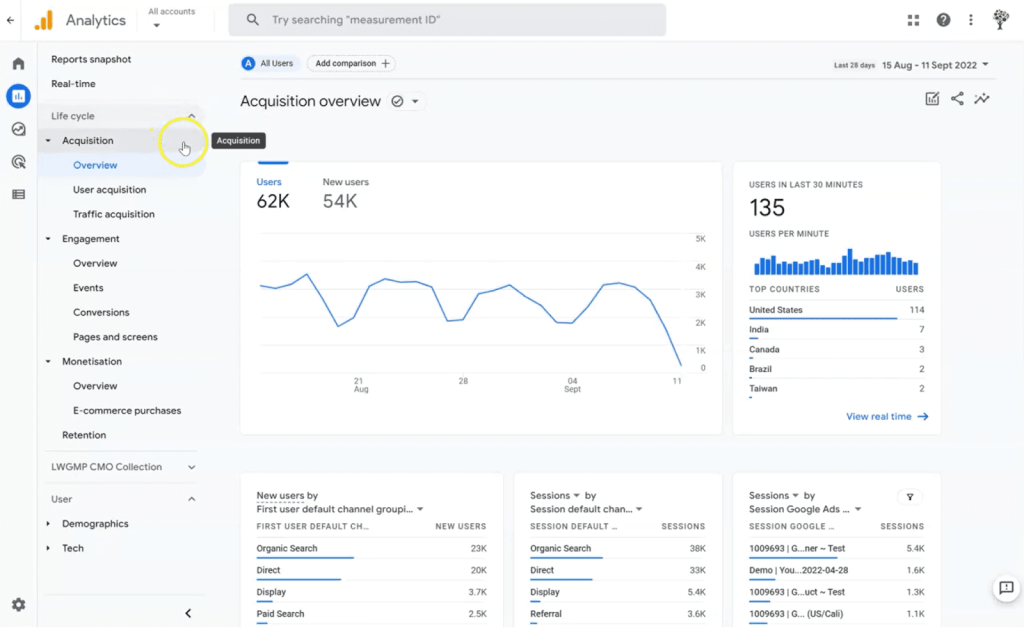
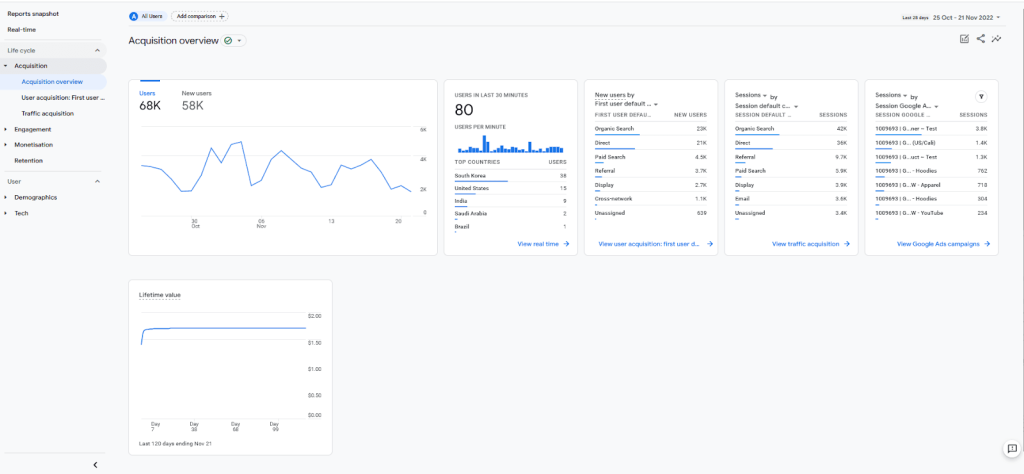
Acquisition: How users arrived at your site. The User Acquisition report provides metrics broken down by channel, at a user level, with some additional channels compared to Universal Analytics, such as Paid Video and Cross-network. Although currently not customisable, this is due to change with future updates.
Traffic Acquisition provides a similar set of metrics but at a session level. You can also see your events (such as ‘remove from cart’) within this report.
Engagement: Understanding user behaviour and how users are interacting with your site. The Events report is where all your events are shown. Everything that happens in GA4 is an event. This includes standard events like page view, scroll tracking and session start events. You can also add custom events here which can be created in Google Tag Manager.
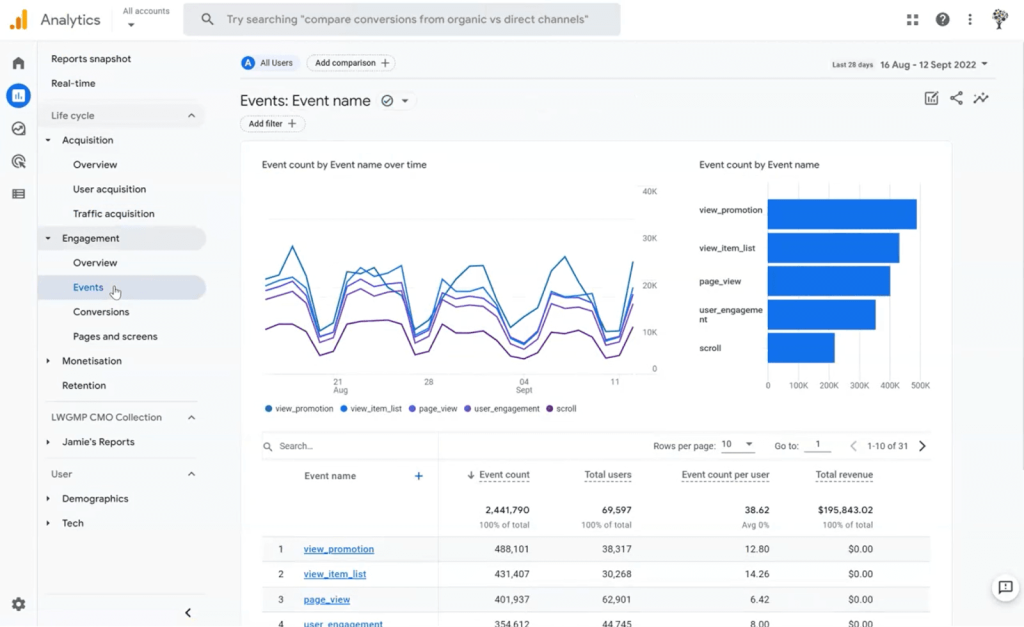
The Conversions report is very similar but shows you those events that you’ve marked as a conversion within the Configure section – more on that below!
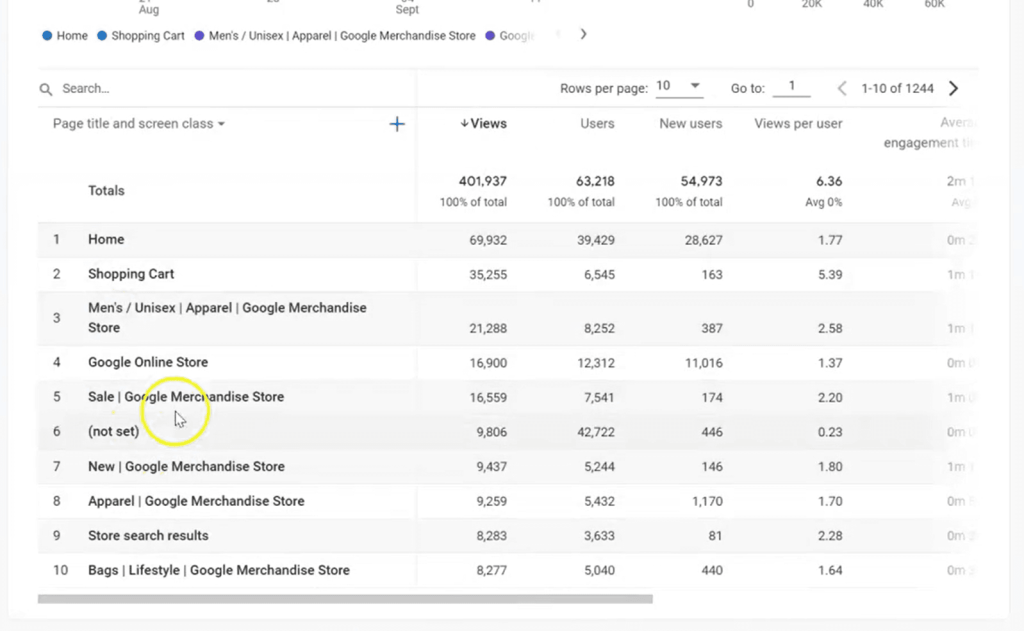
The Pages and Screens report is similar to what you’ll be familiar with in Universal Analytics. You can see key metrics such as views, as well as the events which have happened on those pages. It defaults to the page title but can be changed to display the page path.
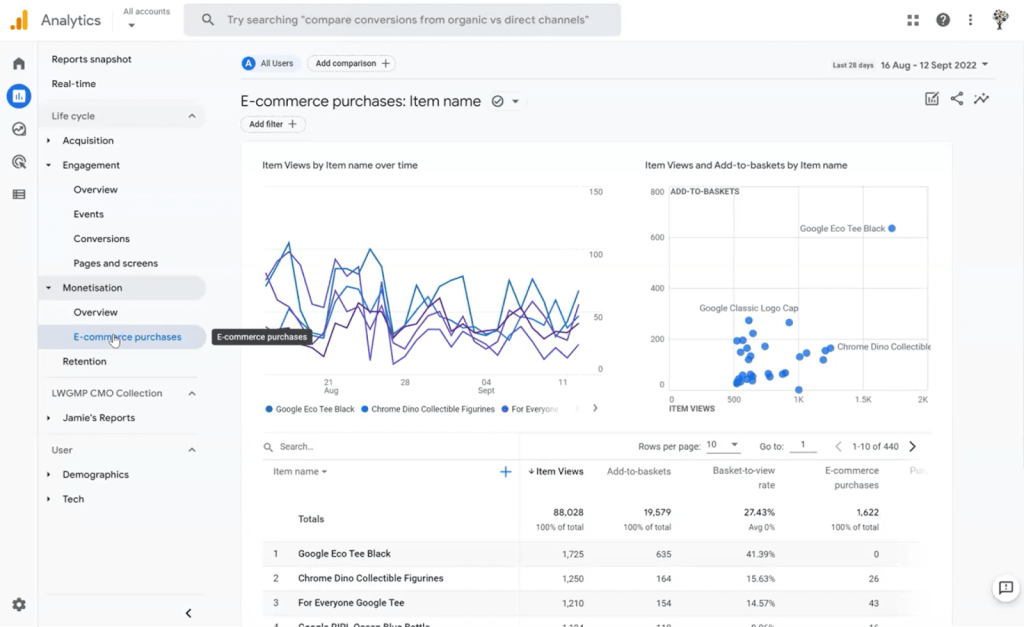
Monetisation: This is the equivalent of the Ecommerce reports within Universal Analytics and covers everything related to revenue and E-commerce. It requires transaction codes to be set up within GTM. If you have Enhanced E-commerce set up, you will see all the data in the predefined reports here such as add to basket, cart abandonment, revenue etc.
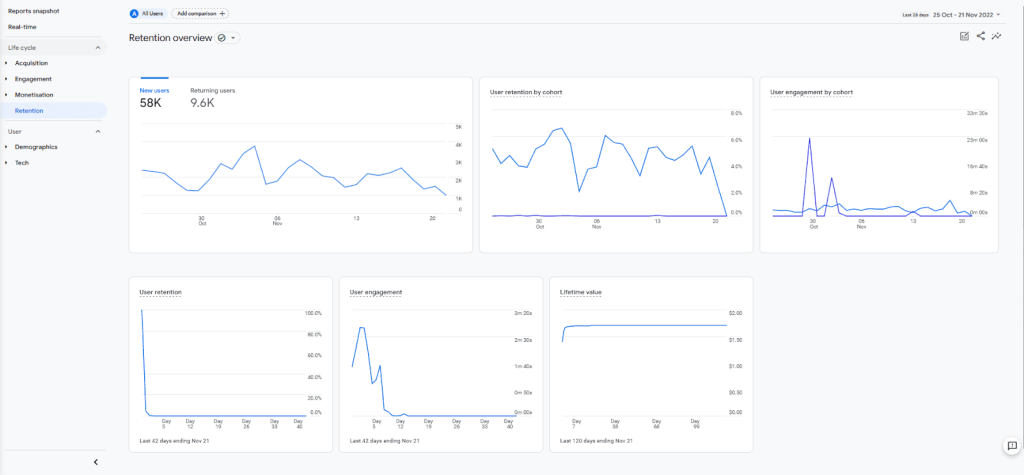
Retention: The Retention report helps you further understand user behaviour such as how long your users interact with your site after their first visit. You can analyse data by user retention, engagement over time and lifetime value, as well as by cohort for a specific set of users.
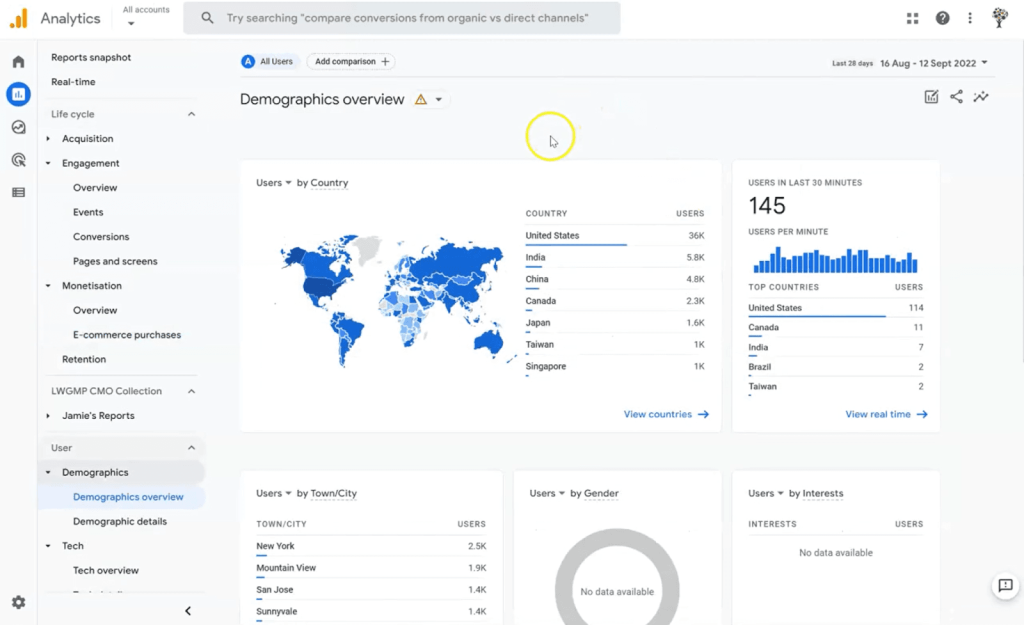
Demographics: The Demographics report is also very similar to that found in Universal Analytics and contains information about the age, location, gender etc. of your users here. For this to be populated with data, you’ll need to have Google Signals enabled.
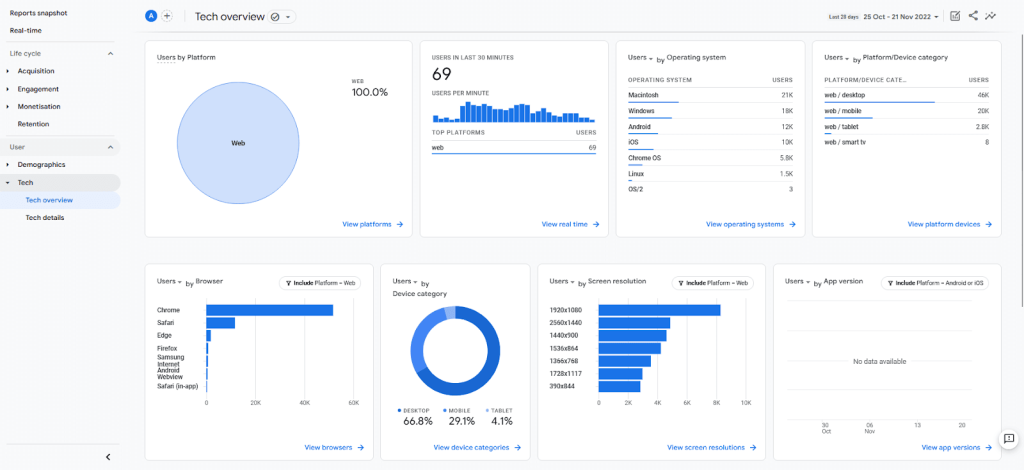
Tech: The Tech report shows data for browser type, device, OS etc. and can be useful for identifying and troubleshooting any technical issues. If you are collecting data for an app, you’ll also see that here.
Comparing Data In GA4
Where you used to be able to use segments to compare data in Universal Analytics, in Google Analytics 4 you can use the comparison tool. If we use mobile as an example, you can see it gives two different comparisons.
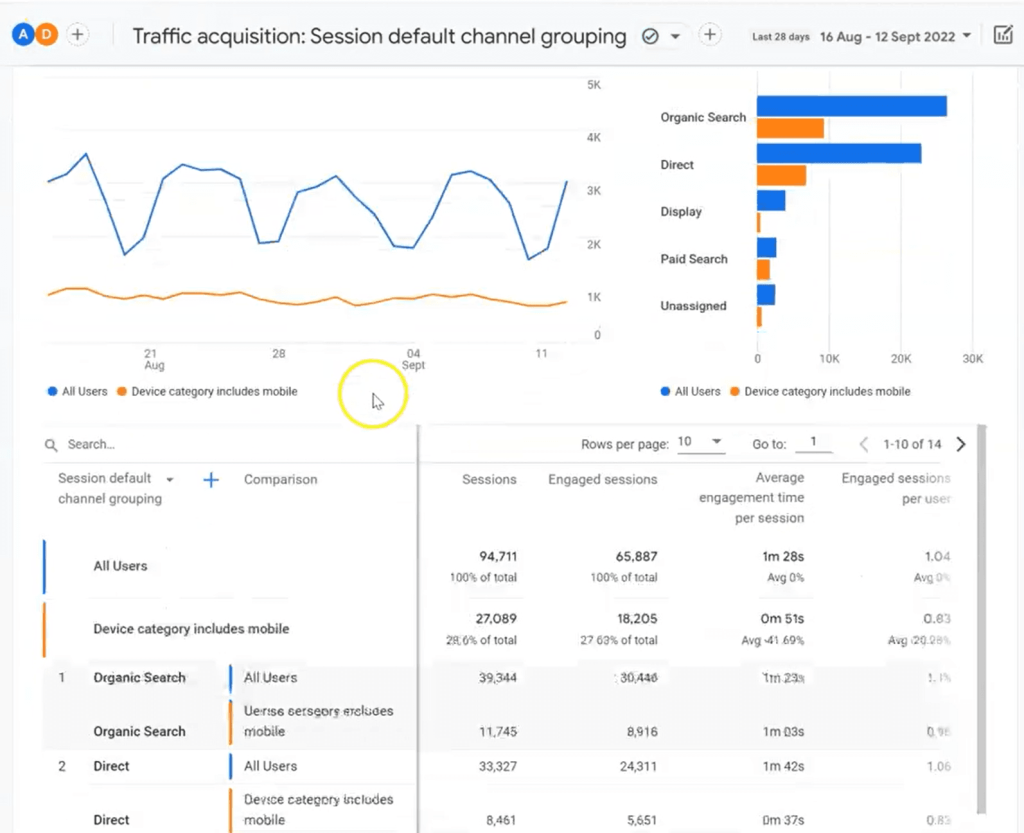
We’ve chosen the Device Category, and you can see this change within the data. We can see here the number of users coming from organic search, but we can also identify the number coming from organic search coming from mobile.
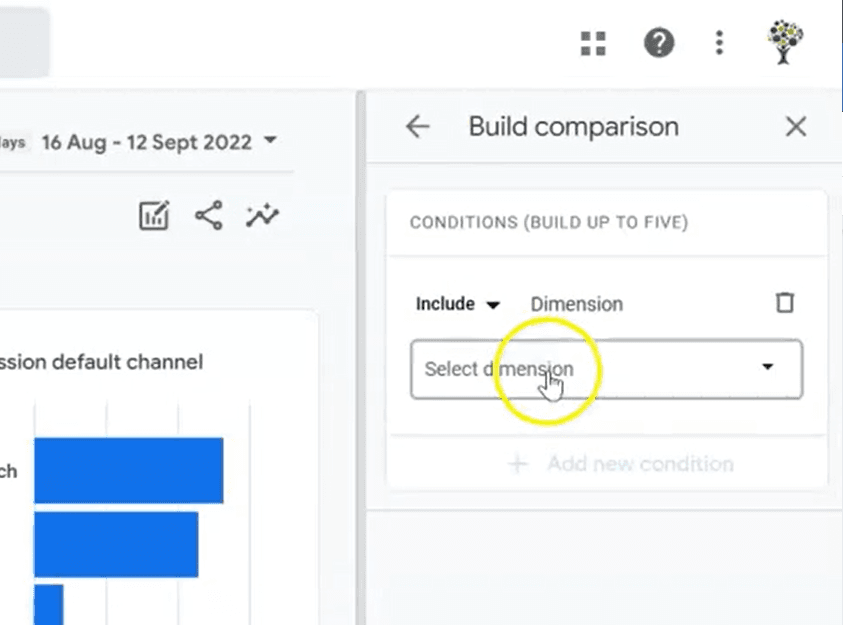
To add a comparison to your report, click ‘Add Comparison’
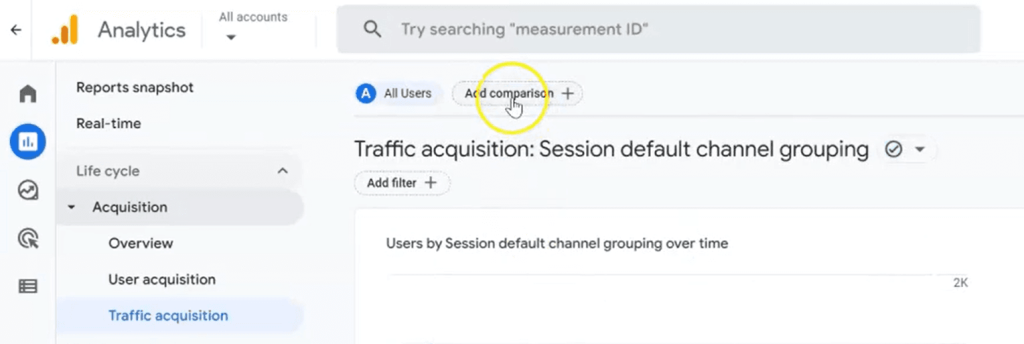
And select ‘Dimension’
Adding A Filter & Switching Dimensions
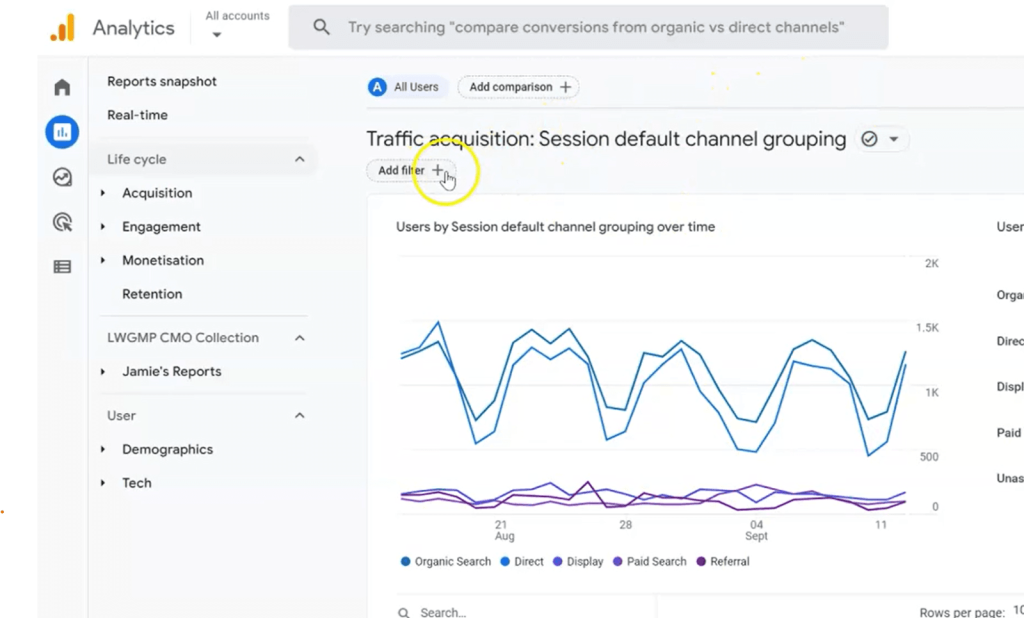
Adding a filter, such as mobile again, filters the entire report so you can only see and analyse this data. This is useful if you only want to see data from a specific channel or device, for example. Click ‘Add filter’ and select ‘Include [name]’
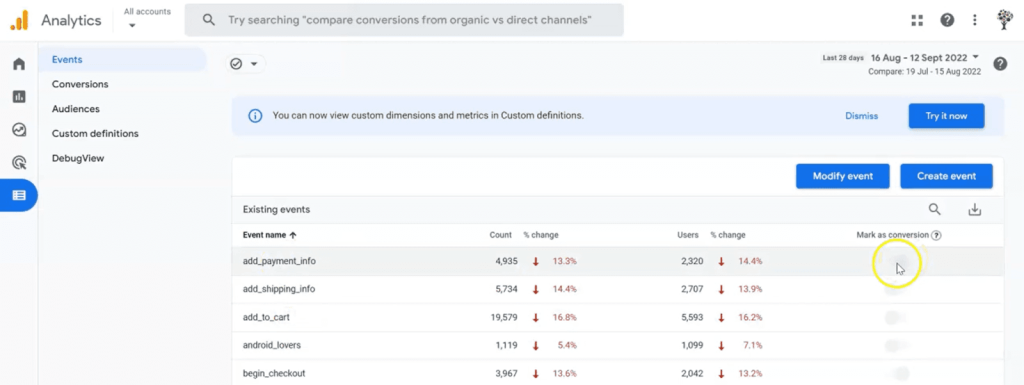
Configuring GA4 Conversions Reports
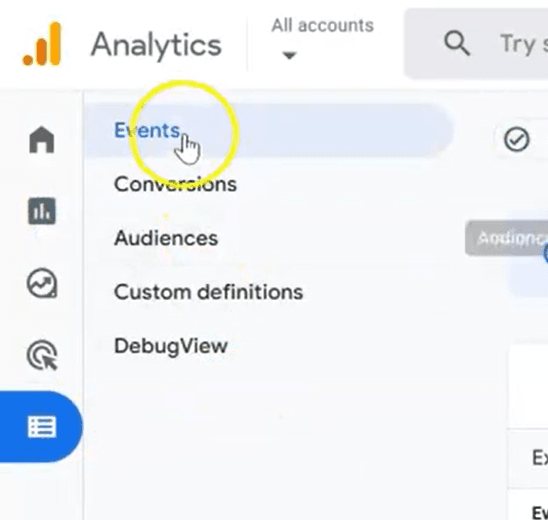
To configure your conversions, click Configure > Events > Mark as conversion
How to Customise the GA4 User Interface
You may wish to change the GA4 interface for any number of reasons. Many organisations will have created custom traffic or user acquisition reports in Universal Analytics, and have ways of reporting to internal stakeholders that they wish to replicate. Others may simply wish to show the metrics that matter to them and forego many of the additional features within the new platform. Fortunately, Google allows a sizable amount of customisation within the Reports section to suit most business needs.
In this section, we’re going to run through how to change the GA4 reporting interface to suit you.

Begin by clicking ‘Library’ to open the section where you can edit your collections:
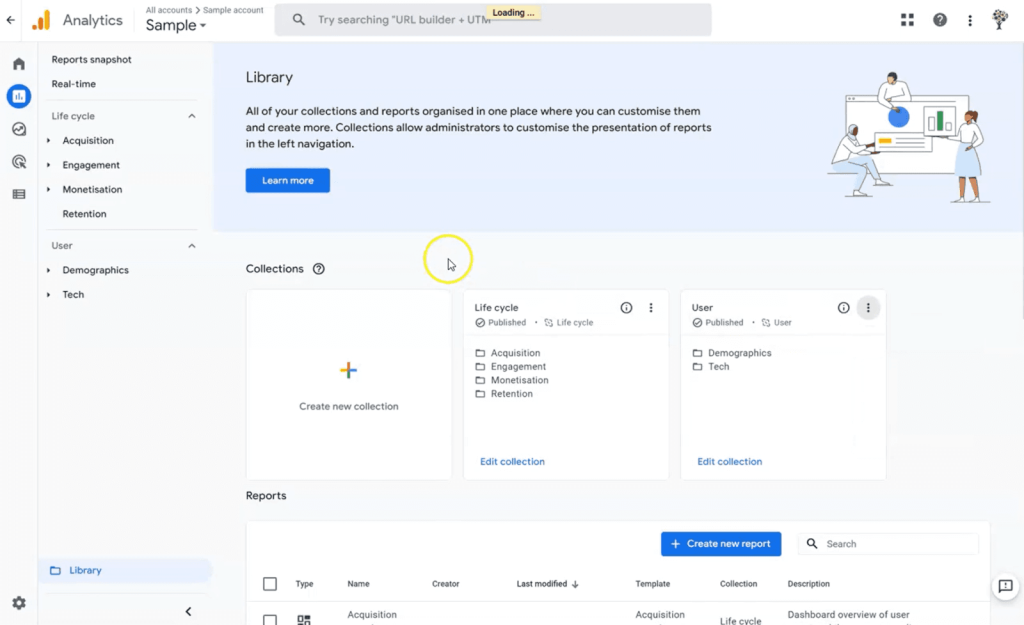
By default, the Life Cycle and User collections are published, but if you find you’re not using these predefined reports, you can hide them from the sidebar. Note that this will affect all users of this View.
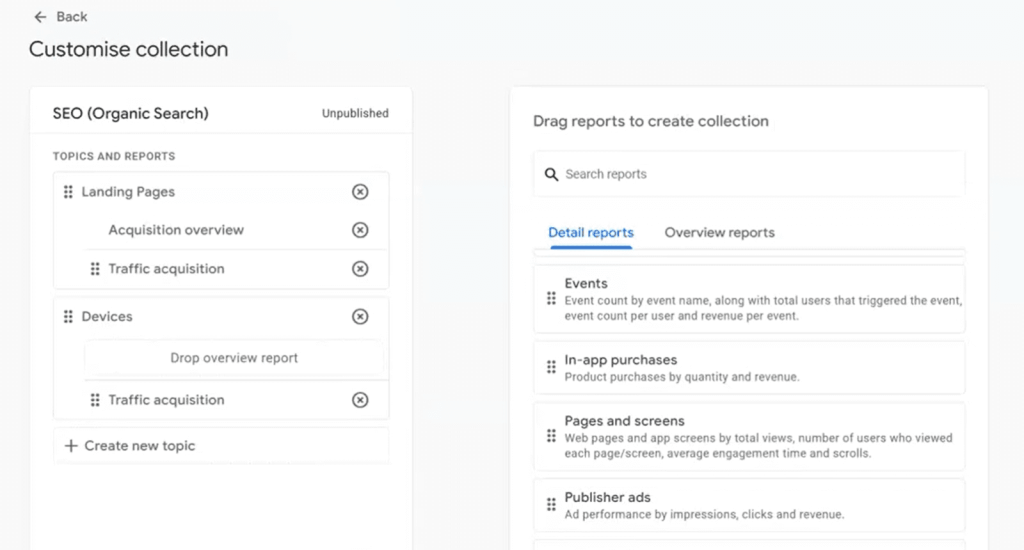
Next, we’re going to try and replicate some common Universal Analytics reports such as Landing Pages or Device Overview. In this example, we’re going to create a custom collection for common SEO metrics called ‘SEO (Organic Search)’.
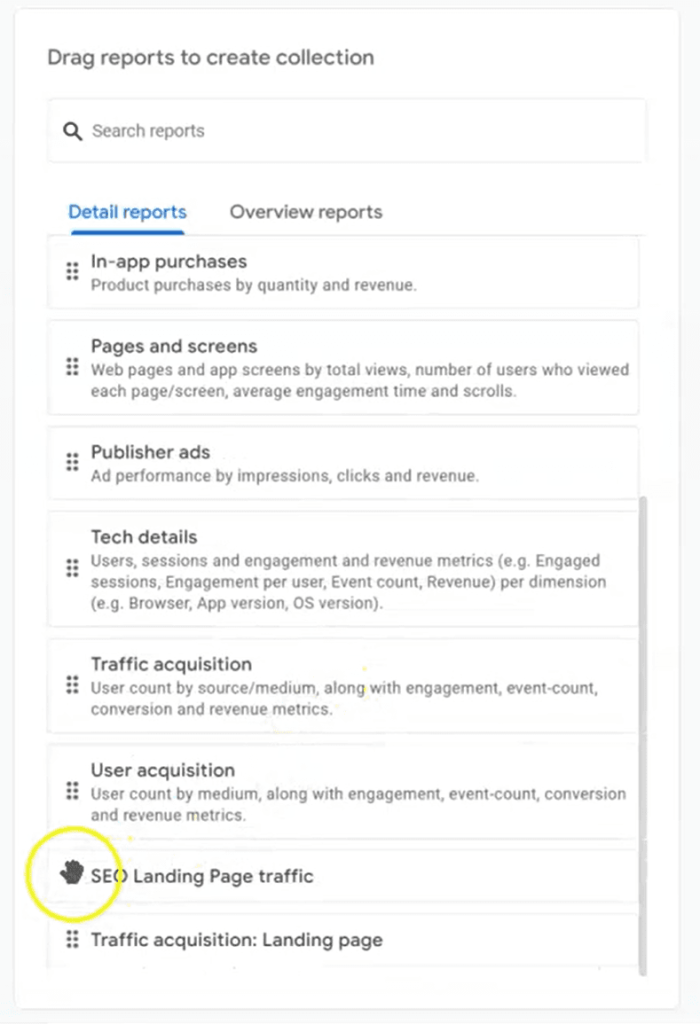
Click ‘Create new collection’ and select a blank report template. Add your name and then ‘Create new topic’. We’ve created ‘Landing Pages’ and ‘Devices’, and dragged the following reports from the section on the right:
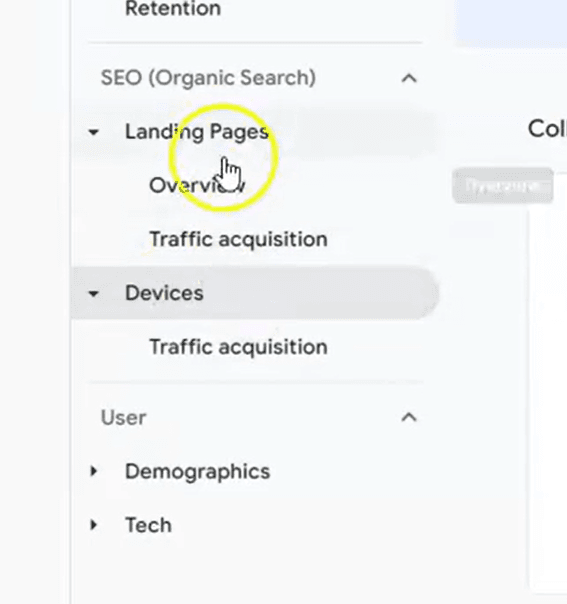
Hit save and then go back and hit publish for it to appear in the sidebar:
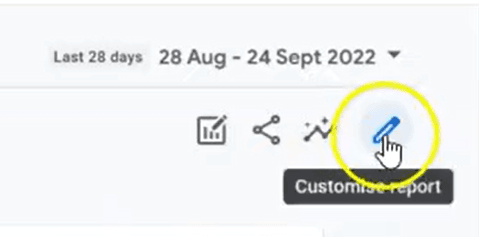
We’ll need to then edit these to show the correct data. Click ‘Customise report’ in the top right of the screen.
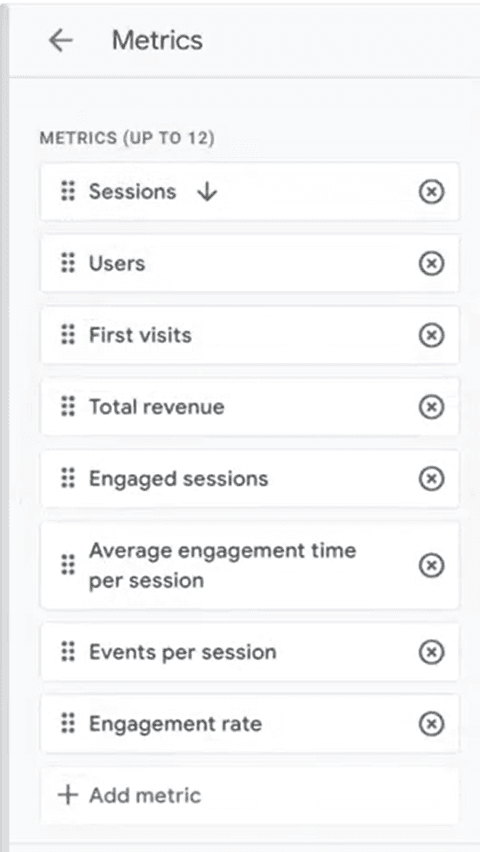
Click ‘Add dimension’ to add any dimension that is available within GA4. In this instance, we’re going to select ‘Landing page’ and change the metrics to only show those which are relevant to our business:
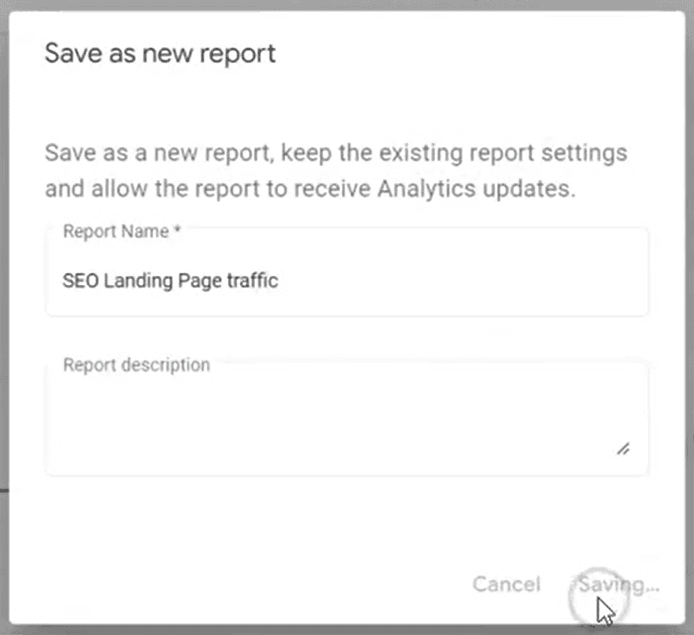
As we’re creating a custom report for ‘SEO’ we need to add a filter for session medium and set it to Organic. In this section, you can also change the appearance of the report by selecting bar charts or line charts, among others. Hit Save and save as a new report.
Once you’ve gone back to your Library, edit the collection you’ve just made:
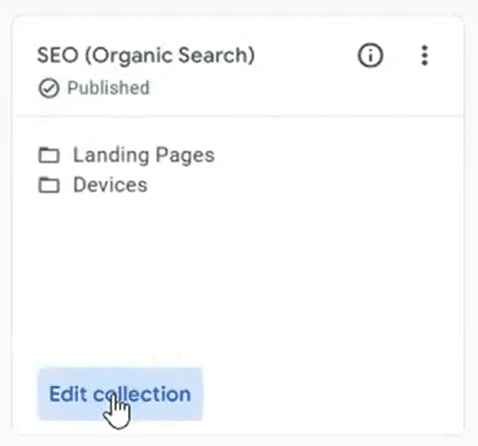
Replace the old Traffic acquisition report with the new custom report you’ve just created.
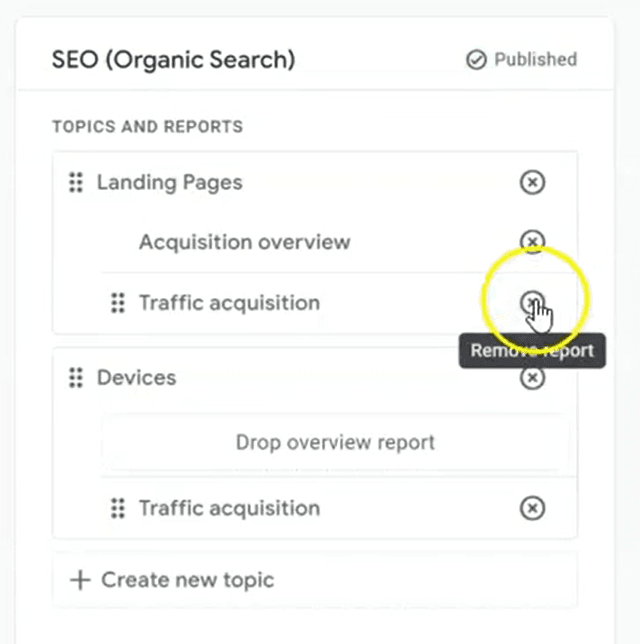
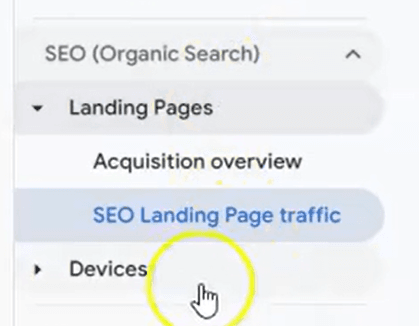
Now, you should have your brand new report in the sidebar with all the standard reports.
You can create a whole raft of different reports for things like events, search terms, paid campaigns, locations etc. So far, the limit seems to only be your imagination. What’s more, you can edit the existing reports provided by Google to include new metrics or remove existing ones which aren’t relevant.
Finally, the overview reports can be updated to show important, at-a-glance information that’s shareable for team meetings, senior management, or client reporting among many other things:
And that’s it! With GA4 still being so new, we expect a lot more customisable features to be added over the coming months and years, allowing you to report on all the metrics that matter.
If you have any questions or comments regarding this process of customising your GA4 reports, don’t hesitate to contact us. To learn more about GA4 take our free training course The Essential Guide to GA4. In it, you’ll learn the steps needed to make the switch from Universal Analytics and find some easy-to-follow guides on the new insights and reporting to get you up and running!